Engine Benchmarks - Vayu vs wrk vs vegeta
How fast is Vayu's load-test engine relative to the established native load
testers? This page documents a head-to-head against
wrk and vegeta,
the methodology, and how to reproduce it.
TL;DR - Vayu is in the same performance class as wrk and vegeta. On a
standalone engine, tuned, it reached 56,880 req/s against a loopback mock -
104.8% of wrk measured on the same machine in the same session (54,280) -
with every client converging on the same ~57k system ceiling. Driven from the
app's own UI, a 60 s run sustained 51,922 req/s / 3.1 M requests with zero
errors. The dominant tuning lever is not an engine knob at all: it is the run's
own concurrency, and the optimum on this target is 64.
Methodology
- All three clients hit the same mock server (
scripts/test/mock-server.go,:8080,/fastendpoint - an 11-byte response with ~1 µs handler latency), so the comparison is apples-to-apples. Endpoint choice does not move the number (wrk:/54,096,/fast53,994,/string54,471 req/s), so neither the response body nor the per-handler work is the limiter. - Peak numbers come from a standalone engine daemon, not from the app. Running through the app costs a measured ~9% on this machine (see The app-engine gap). The UI is for driving and visualising tests; the standalone daemon is for measuring peak engine RPS.
- Matched concurrency. wrk holds
-cconnections, vegeta runs-rate=N -max-workers=N(open-loop), Vayu runs closed-loop constant-concurrency (concurrency=N, no target rate). 10-20 s per run for the sweeps, 60 s for headline figures, with cooldowns between runs. - All runs are error-free (0 non-2xx, 0 failures, 0 dropped) - across roughly 23 M requests through Vayu in the 2026-07-29 session alone.
- Compression is part of the measurement, and a setting (issue #1229). Since
that change a load run negotiates a compressed response by default
(
loadNegotiateCompression), so a server that compresses is measured as its clients experience it: fewer bytes on the wire, a decode per response, and the server's own compression cost included. The figures above predate it and were taken against an 11-byte endpoint no server would compress, so they are unaffected; a comparison against a compressing endpoint has to state which way the setting was. Turn it off to measure an uncompressed ceiling. Every size the run reports is the bytes Vayu holds, which is the decoded response either way.
Hardware
MacBook Pro M3 Pro, 18 GB, macOS. 12 cores = 6 performance + 6 efficiency
(no SMT). This asymmetry matters: macOS assigns threads to P- vs E-cores by QoS
class, and on a single machine the load-test client and the mock server share
the same 12 cores - so the measured ceiling (~57k RPS for a trivial request) is
a shared system limit, not any one client's ceiling. ulimit -n was
1,048,576 and never a constraint.
Results (2026-07-29, engine 0.11.0)
Headline
| req/s | vs wrk |
|
|---|---|---|
| Vayu, standalone engine (c=64, workers=8, verbose 1) | 56,880 | 104.8% |
wrk (-t6 -c64 -d10s) |
54,280 | 100% |
vegeta (-rate=90000 -max-workers=400, achieved) |
51,847 | 95.5% |
| Vayu, through the app's engine (c=64, 30 s) | 52,028 | 95.9% |
| Vayu, started from the app UI (c=64, 60 s) | 51,922 | 95.7% |
The wrk figure here (54,280) was measured with the app and its engine alive in
the background; an earlier sweep on a quieter machine put wrk at 56,649. Read
the ratio, not the absolute: all clients land between 52k and 57k, and Vayu
sits at the top of that band when measured the same way wrk is.
Reference clients
| Client | Configuration | Result |
|---|---|---|
wrk |
-t6 -c64 -d10s |
54,280 req/s, p50 1.10 ms, p99 1.21 ms |
wrk |
-t6 -c128 -d8s |
54,138 req/s, p50 2.32 ms |
wrk |
-t6 -c256 -d8s |
53,059 req/s, p50 4.70 ms |
vegeta |
-rate=90000 -max-workers=400 -duration=8s |
51,847 achieved of 90,000 requested, 100% success, mean 7.66 ms |
Concurrency sweep (app engine, workers=12, 9 s per point)
| concurrency | 32 | 64 | 128 | 192 | 256 |
|---|---|---|---|---|---|
| throughput | 51,215 | 52,158 | 51,986 | 51,398 | 49,516 |
| p50 (ms) | 0.60 | 1.13 | 2.25 | 3.44 | 4.59 |
| p95 (ms) | 0.75 | 1.52 | 3.40 | 5.34 | 9.54 |
| p99 (ms) | 0.93 | 2.90 | 9.01 | 10.78 | 23.18 |
| errors / dropped | 0 / 0 | 0 / 0 | 0 / 0 | 0 / 0 | 0 / 0 |
Peak is a broad plateau across c=32-192 that degrades past 256. Latency scales almost exactly linearly with concurrency while throughput stays pinned - the signature of a saturated target, not a client running out of capacity. Neither side is CPU-bound at that point: sampled mid-run at 52,738 req/s, the system was 79% idle (~2.5 of 12 cores busy).
Concurrency is the single largest lever, and over-driving costs more than any engine knob returns:
| c=400 | c=64 | change | |
|---|---|---|---|
| throughput | 44,299 | 52,028 | +17.4% |
| p50 | 7.28 ms | 1.19 ms | 6x better |
| p99 | 59.90 ms | 1.57 ms | 38x better |
| p999 | 307.46 ms | - | gone |
workers A/B: 8 vs 12
Interleaved A/B/A/B/A/B on a standalone engine to control for drift, 3 reps per
arm, c=64, 20 s per run, --verbose 0. No restarts - workers is read per run.
| rep | workers | throughput | p50 | p95 | p99 | OS threads mid-run |
|---|---|---|---|---|---|---|
| 1 | 12 | 56,201 | 0.96 | 2.21 | 4.39 | 29 |
| 1 | 8 | 54,458 | 1.07 | 1.44 | 3.44 | 25 |
| 2 | 12 | 55,885 | 0.94 | 2.33 | 4.86 | 29 |
| 2 | 8 | 56,849 | 1.08 | 1.35 | 1.86 | 25 |
| 3 | 12 | 55,960 | 0.94 | 2.31 | 4.65 | 29 |
| 3 | 8 | 56,587 | 1.08 | 1.37 | 2.15 | 25 |
| metric | workers=12 | workers=8 | winner |
|---|---|---|---|
| mean throughput | 56,015 | 55,965 | tie (0.09% apart) |
| mean p50 | 0.947 ms | 1.077 ms | 12, by 0.13 ms |
| mean p95 | 2.28 ms | 1.387 ms | 8, by 39% |
| mean p99 | 4.63 ms | 2.48 ms | 8, by 46% |
Throughput is a statistical tie; the tail is not. 12 workers give a slightly
better median and a distinctly worse tail, consistently across every rep. The
plausible mechanism is that 12 event-loop threads spill onto the 6 efficiency
cores and work landing on an E-core lands in the tail; 8 threads fit the 6
performance cores far more closely. workers = 8 is the recommendation, for
tail latency rather than throughput.
Two things this A/B did not reproduce, both worth noting against the older
numbers below: there was no throughput collapse at workers = ncpu (12 tied
with 8 and never dipped), and workers = 8 was never faster than 12 by more than
noise. The workers=8 spread is inflated entirely by its rep 1 (54,458), the
first run after a config change - excluding it the mean is 56,718.
Verbose logging costs nothing measurable
Same standalone instance, workers = 8, restarted with --verbose 1:
| rep | throughput | p50 | p95 | p99 |
|---|---|---|---|---|
| 1 | 56,652 | 1.09 | 1.31 | 1.70 |
| 2 | 56,880 | 1.08 | 1.32 | 1.78 |
| 3 | 56,773 | 1.06 | 1.45 | 3.12 |
Mean 56,768 with verbose on versus 55,965 off. The shipped app always runs
the engine at --verbose 1 (app/electron/sidecar.ts), which sets
CURLOPT_VERBOSE on the load path - so this was expected to be the biggest
available win, and it is not one. Keep-alive means libcurl emits few debug
events once connections are established, and the log grew only 5,256 bytes
across 3.4 M requests. Gating the debug callback on log level remains worthwhile
hygiene; it is not a performance lever.
Per-phase histograms cost under 2% (2026-08-11, engine 0.15.0)
phaseHistograms (issue #476) adds five hdr_record_value_atomic calls per
successful completion - the DNS/connect/TLS/first-byte/download bank behind
the report's timingBreakdown.phases. It defaults on, and this is the
measurement that decides that.
Different hardware from every other figure on this page. Measured on a 4-core Linux container, not the M3 Pro, with the mock server sharing those same 4 cores - so the ceiling is ~18.9k req/s, a third of the M3 Pro's. Read the A/B ratio, not the absolute numbers.
Same daemon, same target, same run config; only the run's own
phase_histograms override differs, so no restart separates the arms.
constant_concurrency 64, 20 s per run, 4 s cooldown, 19 runs per arm - 14
with ON first in each pair and 5 with the order reversed, because a fixed
within-pair order would let any drift land entirely on one arm.
| statistic | ON | OFF | delta |
|---|---|---|---|
| median req/s | 18,578 | 18,869 | -1.54% |
| mean req/s | 18,242 | 18,694 | -2.42% |
| mean, lowest run per arm dropped | - | - | -1.78% |
The raw mean is the only figure past 2%, and one run does all of that work: a single ON rep landed at 14,641 req/s, 21% under the next-lowest run in either arm. Per-arm spread is 12-25%, so a 1.5% difference is at the edge of what this box resolves at all - and the two orderings disagree in size (-1.83% ON-first, -0.97% OFF-first).
What the bank actually costs, measured without the shared-core confound. Timing the five records directly against the same vendored HdrHistogram, with the value mix a real run produces (mostly zeros - a reused connection does no DNS and no handshake, so the writes concentrate on one bucket and contend maximally):
| writer threads | latency histogram only | plus 5 phases | marginal |
|---|---|---|---|
| 1 | 36 ns | 196 ns | 160 ns / completion |
| 2 | 76 ns | 357 ns | 281 ns / completion |
| 4 | 91 ns | 440 ns | 349 ns / completion |
At the measured 18.9k req/s ceiling, 349 ns per completion is 6.5 ms of CPU per second - 0.65% of one core, 0.16% of this 4-core box. That is an order of magnitude below the end-to-end spread, which is the strongest evidence that the 1.5% seen there is this container's variance rather than the bank.
Verdict: default stays on. Every outlier-robust statistic is under the 2%
line the issue set, and the direct measurement accounts for a sixth of even
that. phaseHistograms (engine config) and phase_histograms (per run) turn it
off for anyone whose target proves otherwise; off leaves the bank unallocated,
so the completion path pays one null check.
The iteration identity: unresolvable against this host's noise (2026-08-27, engine 0.23.0)
{{$vu}} / {{$iteration}} (issue #994) bind per submission on the load path,
which is the kind of change #992's throughput guard exists for. Two questions,
measured separately, and neither answer is a number this host can pin down as
tightly as the phaseHistograms measurement above pinned its own.
The bind, when a run uses it. One daemon, three arms interleaved and rotated
per round so drift lands on all three - a plain URL (off), the same URL with
the query the tokens would produce written out (?u=1&i=0), and the same URL
with the tokens in it. constant_concurrency, c=32, 6 s per arm, 12 rounds,
retention effectively off (a sampling period of 100000).
| Arm | Median req/s | Mean | Min | Max |
|---|---|---|---|---|
| off (no query, no tokens) | 33 160 | 32 816 | 28 609 | 35 876 |
literal (?u=1&i=0) |
32 367 | 32 611 | 29 322 | 35 627 |
on (?u={{$vu}}&i={{$iteration}}) |
32 145 | 32 386 | 29 179 | 35 071 |
The bind alone is on against literal - identical bytes on the wire and
identical work at the target, differing only in the join: -0.68% on medians.
The two arms' own min-max spans are ~20% wide, so that figure bounds the cost
rather than measuring it.
The feature-off path, against master. The same payload with no reserved
token at all, run against master's binary and this branch's, one daemon at a
time, alternating every round (12 rounds, 5 s, c=32): a paired median of
-2.48%. That is not a result on its own, and the null test is why - the same
harness with this branch's binary in both arms reports -1.39%, so
roughly that much of it is the harness rather than the code. What is left is
inside a per-round spread running from -12% to +6%.
Verdict: no change is resolvable here, and the structural claim is what the
guard rests on. A request spelling no reserved token has an empty template,
which the submission path tests before doing anything: no copy, no bind, the
same submit of the same shared request
(LoadIdentityTest.ARunWithoutTheTokensCarriesAnEmptyTemplate asserts the empty
template rather than the throughput). What every load run does now pay is one
unsynchronised size_t increment per submission on the sole producer thread -
the counter that lets any run tell a deferred script which iteration a sampled
response was sent in. Anyone re-measuring should do it on a quiet host: this one
is a 4-core container running the Go mock server beside the engine, and a single
arm's own runs vary by more than either effect being looked for.
Per-iteration generators: also inside this host's noise (2026-08-28, engine 0.23.0)
The {{$guid}} family generates per iteration on the load path since issue
995, where it used to be resolved once at composition and repeated for the
whole run. It is the same shape of change the identity was, one step more expensive: a generator has to run per occurrence per iteration, where the identity substitutes two integers the executor is already holding.
The generation, when a run uses it. One daemon, four arms interleaved and
rotated per round so drift lands on all four - a plain URL (off), the same URL
with a uuid written out (literal), the same URL with {{$iteration}} in it
(identity - the bind path #994 already put every bound run on, generating
nothing), and the same URL with {{$randomUUID}} in it (on).
constant_concurrency, c=32, 5 s per arm, 8 rounds, retention effectively off
(a sampling period of 100000).
| Arm | Median req/s | Mean | Min | Max |
|---|---|---|---|---|
| off (no query, no token) | 20 007 | 20 358 | 19 183 | 21 846 |
literal (?u=<a uuid>) |
21 367 | 20 806 | 16 078 | 23 473 |
identity (?u={{$iteration}}) |
21 990 | 21 766 | 19 583 | 23 493 |
on (?u={{$randomUUID}}) |
20 854 | 21 051 | 19 614 | 22 678 |
Nothing is resolvable. on lands above off and below identity; the
arms' own min-max spans are 12-46% wide, which is wider than any distance
between them. The one number worth keeping is what the arms say together: three
of the four bind per submission - identity and on copy the request and
rebuild a field, on also runs the table - and they do not separate from the
two that do not.
An unrotated first pass had on 26% below off, which is the whole reason the
method rotates: that reading came from one round in a fixed order, and it did
not survive eight rounds of rotation. A single ordered pair on this host is not
evidence.
The feature-off path, against master. The same payload with no token at all,
run against master's binary and this branch's, one daemon at a time,
alternating every round (10 rounds, 5 s, c=32): a paired median of -0.01%
(master 25 279, branch 25 276). The null test says how much of that to believe -
the same harness with this branch's binary in both arms reports -1.51%,
so the harness alone moves the number further than the change did. Per-round
deltas run from -17% to +30%.
Verdict: no change is resolvable here either, and the guard is structural. A
request spelling no generator has nothing left for the compose-time split to
find, so its template is empty and the submission path takes the branch it
always did - no copy, no join, the same submit of the same shared request.
LoadDataTest.ARunWithoutAGeneratorCarriesAnEmptyTemplate and
ScenarioPlanTest.AStepWithoutAGeneratorCarriesAnEmptyTemplate assert that
emptiness rather than a throughput figure, which is the claim that can actually
be pinned. Same host caveat as the section above: a 4-core container running the
Go mock server beside the engine, where a single arm's own runs vary by more
than either effect being looked for.
SSE frame counting: not yet measured (issue #576)
Streaming under load puts a second thing on the write callback's hot path: an
SseFrameCounter fed every byte of every streaming transfer. It is a per-byte
loop over a nine-byte state machine with no allocation and no string building -
a scan, not a parse - and it runs only for transfers carrying
stream_bounds, so an ordinary load run pays one std::optional check per
callback and nothing else.
There is no number here yet, and this section exists to say so rather than to imply one. The measurement belongs with the other hot-path figures on this page, on a quiet host, against a streaming fixture rather than the buffered mock server every figure above uses - a stream's cost profile is nothing like a small JSON body's, so folding it into an existing sweep would compare two different workloads. It is tracked with the other parked benchmark work in #197; the shape to measure is bytes/second through the counter versus the same transfer with counting disabled, at the chunk sizes libcurl actually delivers.
What is already known without a run: the counter cannot change a non-streaming run's cost, because the branch that reaches it is not taken.
The run-scoped 1 ms timer request: pacing unchanged, idle holds nothing (2026-09-04, Windows)
Issue #1161 moved Windows' timeBeginPeriod(1) from process start to the
event loop's lifetime (platform::HighResolutionTimerScope, one refcounted
request per run), and #1296 is the measurement its second acceptance criterion
asked for and a Linux host could not take: on Linux the scope compiles to a
counter, so the platform where the numbers could differ is the only one worth
measuring on. Two questions, each with its own instrument.
Different hardware again. A 4-core / 8-thread Intel i5-8300H laptop,
Windows 11 Home 24H2 (build 26200), 16 GB, the target sharing those cores.
Release builds of engine 0.24.0 (1d20f4f4, the commit before #1295
merged: "before") and 0.25.0 (711f359f: "after"), each started fresh per
run with --verbose 1 and a scratch data dir, so nothing carries over between
arms. workers was left at its default, which auto-detects to
hardware_concurrency() - 8 here - on both arms; pacing is a single producer
thread and at these rates the workers are mostly idle, so the count is a
constant across the comparison rather than a lever in it.
Pacing. constant_rps runs of 20 s at 200 and 400 RPS (the sleep_for
leg, below the ~500 RPS point where a tick's remainder is spun instead) and at
1500 RPS (the spin leg, 1 ms ticks), 3 rounds, the two arms alternated within
each round. The achieved rate is the report's sendRate. The spread is read
off the receiving side rather than the engine's counters: the target is the
same 11-byte /fast as scripts/test/mock-server.go with one addition, a
monotonic arrival timestamp per request, and the gaps between consecutive
arrivals are what the table reports. "Nominal" is 1e6 / RPS microseconds;
"within 25%" is the share of gaps inside a quarter of nominal on either side,
"under 10%" the share that are catch-up bursts.
| target RPS | arm | sent rate (median of 3) | dropped | gap p50 / p90 / p99 / max (us) | within 25% | under 10% | per-second stdev | p99 latency |
|---|---|---|---|---|---|---|---|---|
| 200 | before | 199.92 | 0 | 5733 / 5882 / 8782 / 10478 | 77.5% | 9.8% | 0.46 | 4.66 ms |
| 200 | after | 199.92 | 0 | 5743 / 5871 / 8758 / 10127 | 78.5% | 7.4% | 0.56 | 4.52 ms |
| 400 | before | 399.89 | 0 | 3515 / 3858 / 6746 / 8205 | 7.7% | 27.2% | 0.89 | 4.77 ms |
| 400 | after | 399.88 | 0 | 3694 / 3830 / 4821 / 6437 | 6.8% | 27.6% | 0.69 | 2.88 ms |
| 1500 | before | 1499.78 | 0 | 540 / 1447 / 1712 / 3458 | 23.8% | 25.9% | 0.92 | 1.10 ms |
| 1500 | after | 1499.77 | 0 | 541 / 1461 / 1666 / 3518 | 21.9% | 27.4% | 0.89 | 1.07 ms |
The furthest any of the 18 runs strayed from its target was 399.14 at 400 RPS,
and no run dropped a request. The achieved rate is identical to the second
decimal in every pair, and at 200 and 1500 RPS every spread statistic agrees
between arms to within its own round-to-round scatter. The 400 RPS before
arm is the one exception, and it is the session's very first run: gap p50 of 0,
max 37 ms, p99 latency 40 ms, a cold daemon on a laptop that had just finished
two builds. Rounds 2 and 3 of that arm read 3688 / 3515 us at p50 and 4810 /
6746 us at p99 against the after arm's 3693-3699 / 4811-5037, so the medians in
the table carry that one run and the arms do not otherwise separate. The
sleep_for leg is the one that would have shown a request not in force - at
the 15.6 ms default a 5 ms sleep returns three ticks late, and the 200 RPS gap
distribution would sit at ~15 ms with two-thirds of the requests arriving in
bursts - and it reads the same on both arms. So the ordering read off the code
in #1295 holds on a trace: configure_event_loop builds the loop, the loop's
first member takes the request, and the strategy's first tick runs under it.
What the table does show, on both arms equally, is the shape of sleep_for at
1 ms resolution: the 200 RPS median gap is 5.7 ms against a 5 ms nominal, and
at 400 RPS (2.5 ms nominal, 2.5 ms sleep - just over the 2000 us threshold
above which the tick sleeps rather than spins) the median is 3.5-3.7 ms with a
quarter of the gaps being the double-dispatch that pays the overshoot back.
The rate is exact because take_due_requests accrues the debt; the
regularity is bounded by the OS sleep granularity. That is a property of the
spin threshold in wait_for_next_tick, not of the scope, and it predates it;
#1370 moved it, and
The sleep a Windows tick cannot trust
below carries the same three rates measured again after that change.
Idle. The fix's actual claim is that a daemon with no run active holds no
request, and powercfg /energy is the tool that reports the request itself:
its "Outstanding Timer Request" entries name each requesting process and the
period it asked for. Taken from an elevated shell against the 0.25.0 daemon
(pid 7688), 5 s report windows, a Chrome tab holding its own 1 ms request
throughout as the control that the report does see holders:
| daemon state | outstanding requests in the report |
|---|---|
| daemon up, idle 5 s | chrome.exe, period 10000 (1 ms). No entry for vayu-engine.exe. |
| 3 s into a 200 RPS run | vayu-engine.exe (pid 7688), period 10000 (1 ms), and chrome.exe |
| 3 s after the run completed | none (Chrome's had lapsed too). No entry for vayu-engine.exe. |
The system-wide "Current Timer Resolution" line read 156250 (15.6 ms) in all
three reports, including the one with two holders listed - since Windows 10
2004 a request raises the resolution for the requesting process, not the
platform, which is also why timeGetDevCaps (a 0.5-15.625 ms capability
range that never moves) says nothing here.
The same three states, plus the two daemons side by side, were also read
without elevation through NtQueryTimerResolution from a probe process that
has itself requested a deliberately coarse 10 ms: a requesting process
observes the finest period any process holds, so the probe reads 10.0 ms
when nothing else holds a request and 1.0 ms when anything does, while a
process that never asked keeps sleeping at 15.6 ms regardless. Calibrated
against a helper holding timeBeginPeriod(1): 10.0 without it, 1.0 with it.
| daemon state | before (0.24.0) | after (0.25.0) |
|---|---|---|
| no daemon running | 10.0 ms | 10.0 ms |
| daemon up, idle 5 s | 1.0 ms | 10.0 ms |
| 3 s into a 200 RPS run | 1.0 ms | 1.0 ms |
| 3 s after the run completed | 1.0 ms | 10.0 ms |
| daemon stopped | 10.0 ms | 10.0 ms |
Each cell is corroborated by the probe's own mean Sleep(1): ~10 ms in the
10.0 rows, ~1.9 ms in the 1.0 rows. The old daemon took the request at boot and
kept it for its life; the new one holds it for exactly the span of the run,
and release_execution_resources hands it back as the run is retained.
Verdict: nothing moved, so neither constant needs looking at. The 2000 us
spin threshold and the 1000 us tick_us floor are the two named mechanisms
the issue said to check if a regression appeared; none did. The
Timer resolution paragraph in the architecture
doc stands as written. The 2000 us constant has since changed role rather
than value - #1370 made it the length of a spin tail every tick ends on, not a
threshold below which the whole remainder is spun - so this table's arms are
still the two it names and its numbers still describe the code they were taken
against.
The sleep a Windows tick cannot trust (2026-09-04, Windows)
#1370 is the observation the
table above records: below ~500 RPS a constant_rps tick slept its whole
remainder, landed late, and the next tick paid the overshoot back as a double
dispatch. The fix sizes a spin tail to that overshoot, so the number the tail
has to cover is the measurement that matters.
What sleep_for actually costs. Same host as the section above (i5-8300H,
Windows 11 24H2), a process holding timeBeginPeriod(1) for its whole life -
the condition a run's pacing thread is in - 400 samples per row, reported as
actual - requested:
| requested | p50 | p90 | p99 | max |
|---|---|---|---|---|
| 100 us | 1817 us | 2099 us | 3143 us | 17770 us |
| 500 us | 1377 us | 1626 us | 2157 us | 2908 us |
| 1000 us | 912 us | 1141 us | 1740 us | 2341 us |
| 2000 us | 641 us | 1104 us | 1700 us | 2180 us |
| 2500 us | 961 us | 1616 us | 2220 us | 2837 us |
| 3500 us | 1139 us | 1639 us | 2209 us | 2256 us |
| 5000 us | 596 us | 1068 us | 1571 us | 1683 us |
The overshoot is a wakeup latency, not a proportional error. It barely moves with the duration asked for - asking for 100 us costs about as much extra as asking for 5000 us - so a fixed tail covers every target rate, and the spin's cost stops tracking the rate. That is what picked the hybrid shape over simply raising the old threshold: a threshold sized to cover a 2.5 ms tick spins the whole 2.5 ms, and a slower rate needs a bigger one again.
pacing::SPIN_TAIL_US is 2000 us, the old threshold's value unchanged. It
covers the p50 and p90 of every row, which is what turns the 400 RPS arrival
gap regular; sizing it to p99 instead would roughly double the spin for the
last few percent of ticks, and a sidecar that pins a core is not an
improvement. Keeping the value also leaves every tick from ~500 RPS up
byte-identical, since there the remainder never exceeds the tail.
Before and after, at the receiver. Same instrument as the section above - a
copy of scripts/test/mock-server.go's /fast that stamps a monotonic arrival
time per request - 20 s runs, 3 rounds, the two arms alternated within each
round, a fresh daemon and a scratch data dir per run. "Nominal" is 1e6 / RPS;
"within 25%" is the share of gaps inside a quarter of nominal either side,
"under 10%" the share that are catch-up bursts. The CPU column is the daemon's
busiest thread over the middle 10 s, which at these rates is the producer -
eight workers sharing a handful of requests per millisecond are not the ones
burning it.
| target RPS | arm | sent rate | dropped | gap p50 / p90 / p99 (us) | within 25% | under 10% | producer CPU |
|---|---|---|---|---|---|---|---|
| 200 | before | 199.93 | 0 | 5456 / 6123 / 8612 | 75.7% | 8.0% | 4.2% |
| 200 | after | 199.93 | 0 | 5004 / 5678 / 6412 | 95.7% | 0.0% | 26.6% |
| 400 | before | 399.86 | 0 | 3116 / 4073 / 5312 | 16.5% | 19.4% | 11.2% |
| 400 | after | 399.90 | 0 | 2501 / 3321 / 5011 | 58.5% | 1.2% | 32.3% |
| 1500 | before | 1499.87 | 0 | 502 / 1544 / 3997 | 25.1% | 48.3% | 99.7% |
| 1500 | after | 1499.84 | 0 | 523 / 1505 / 2386 | 26.4% | 32.6% | 99.7% |
Medians of 3 runs per cell, 18 runs in all, no run dropped a request.
The 400 RPS row is the one the issue was filed for, and it moves the way the
mechanism predicts: the median gap falls from 3116 us to 2501 us against a
2500 us nominal, the share of gaps within a quarter of nominal goes from a
minority to a majority, and the catch-up bursts - the double dispatch paying
back the overshoot - all but disappear (19.4% to 1.2%). 200 RPS moves the same
way from a better starting point. 1500 RPS does not move at all, which is
the check that the change is confined to the leg it was meant for: there
tick_us is 1000 us, never exceeds the 2000 us tail, and is spun whole on both
arms. Its within 25% sits near 25% on both arms because a 1 ms tick against a
667 us nominal pays out 1 or 2 requests per tick by design - that is the
tick_us floor, not this change, and it is unchanged.
At the tick itself, the change is total. The receiver-side figures above
carry the network path's own jitter on top of the pacing. Reading the interval
between consecutive submit_due calls instead - a temporary instrumented build,
not committed - isolates the tick, and there the leg does exactly what it was
rewritten to do:
| target RPS | nominal | before p50 / within 25% | after p50 / within 25% |
|---|---|---|---|
| 200 | 5000 us | 5598 us / 94.8% | 5000 us / 100.0% |
| 400 | 2500 us | 3724 us / 1.8% | 2500 us / 100.0% |
| 1500 | 667 us | 1000 us / 0.0% | 1000 us / 0.0% |
600 ticks per cell. The 400 RPS before arm is the defect in one number: a 2500 us
tick that fires every 3724 us. After, the tick fires on its nominal interval and
the spread is gone. The 1500 RPS row is identical on both arms and sits at the
1000 us tick_us floor, by design. The same build shows why: with the tail in
place a 2486 us remainder sleeps 486 us and the sleep returns after 1088-2295 us
- always before the tick - so the spin carries it home every time.
What it costs. The producer thread goes from 4-11% of one core to 27-32%.
That is the point of a tail rather than a raised threshold: the spin runs from
when the sleep returns to the tick, so it costs tail - overshoot and not the
whole tail - about 0.6-0.9 ms of the 2 ms per tick in practice. A spin bounded
at ~1.5 ms per tick, which is what the issue asked this to be no worse than,
would be 60% of a core at 400 RPS and 30% at 200; the measured 32.3% and 26.6%
are inside both. The 1500 RPS rows are at 99.7% on both arms - that leg
already spun every tick before this change, and it is the reason the tail is
capped rather than sized to the p99 of the overshoot.
One caveat on this host. Under heavy background load the whole picture
degrades on both arms - a before run in round 2 read a gap p50 of 0 with 52%
catch-up bursts, and the producer thread at 68% - because a sleeping thread
needs the scheduler to wake it and a loaded box will not. Runs taken while
another build or a virus scan is going are measuring that, not this. The numbers
above were taken on an otherwise idle machine, and the arms were alternated
inside each round so a drift would show up in both.
The in-app proof run
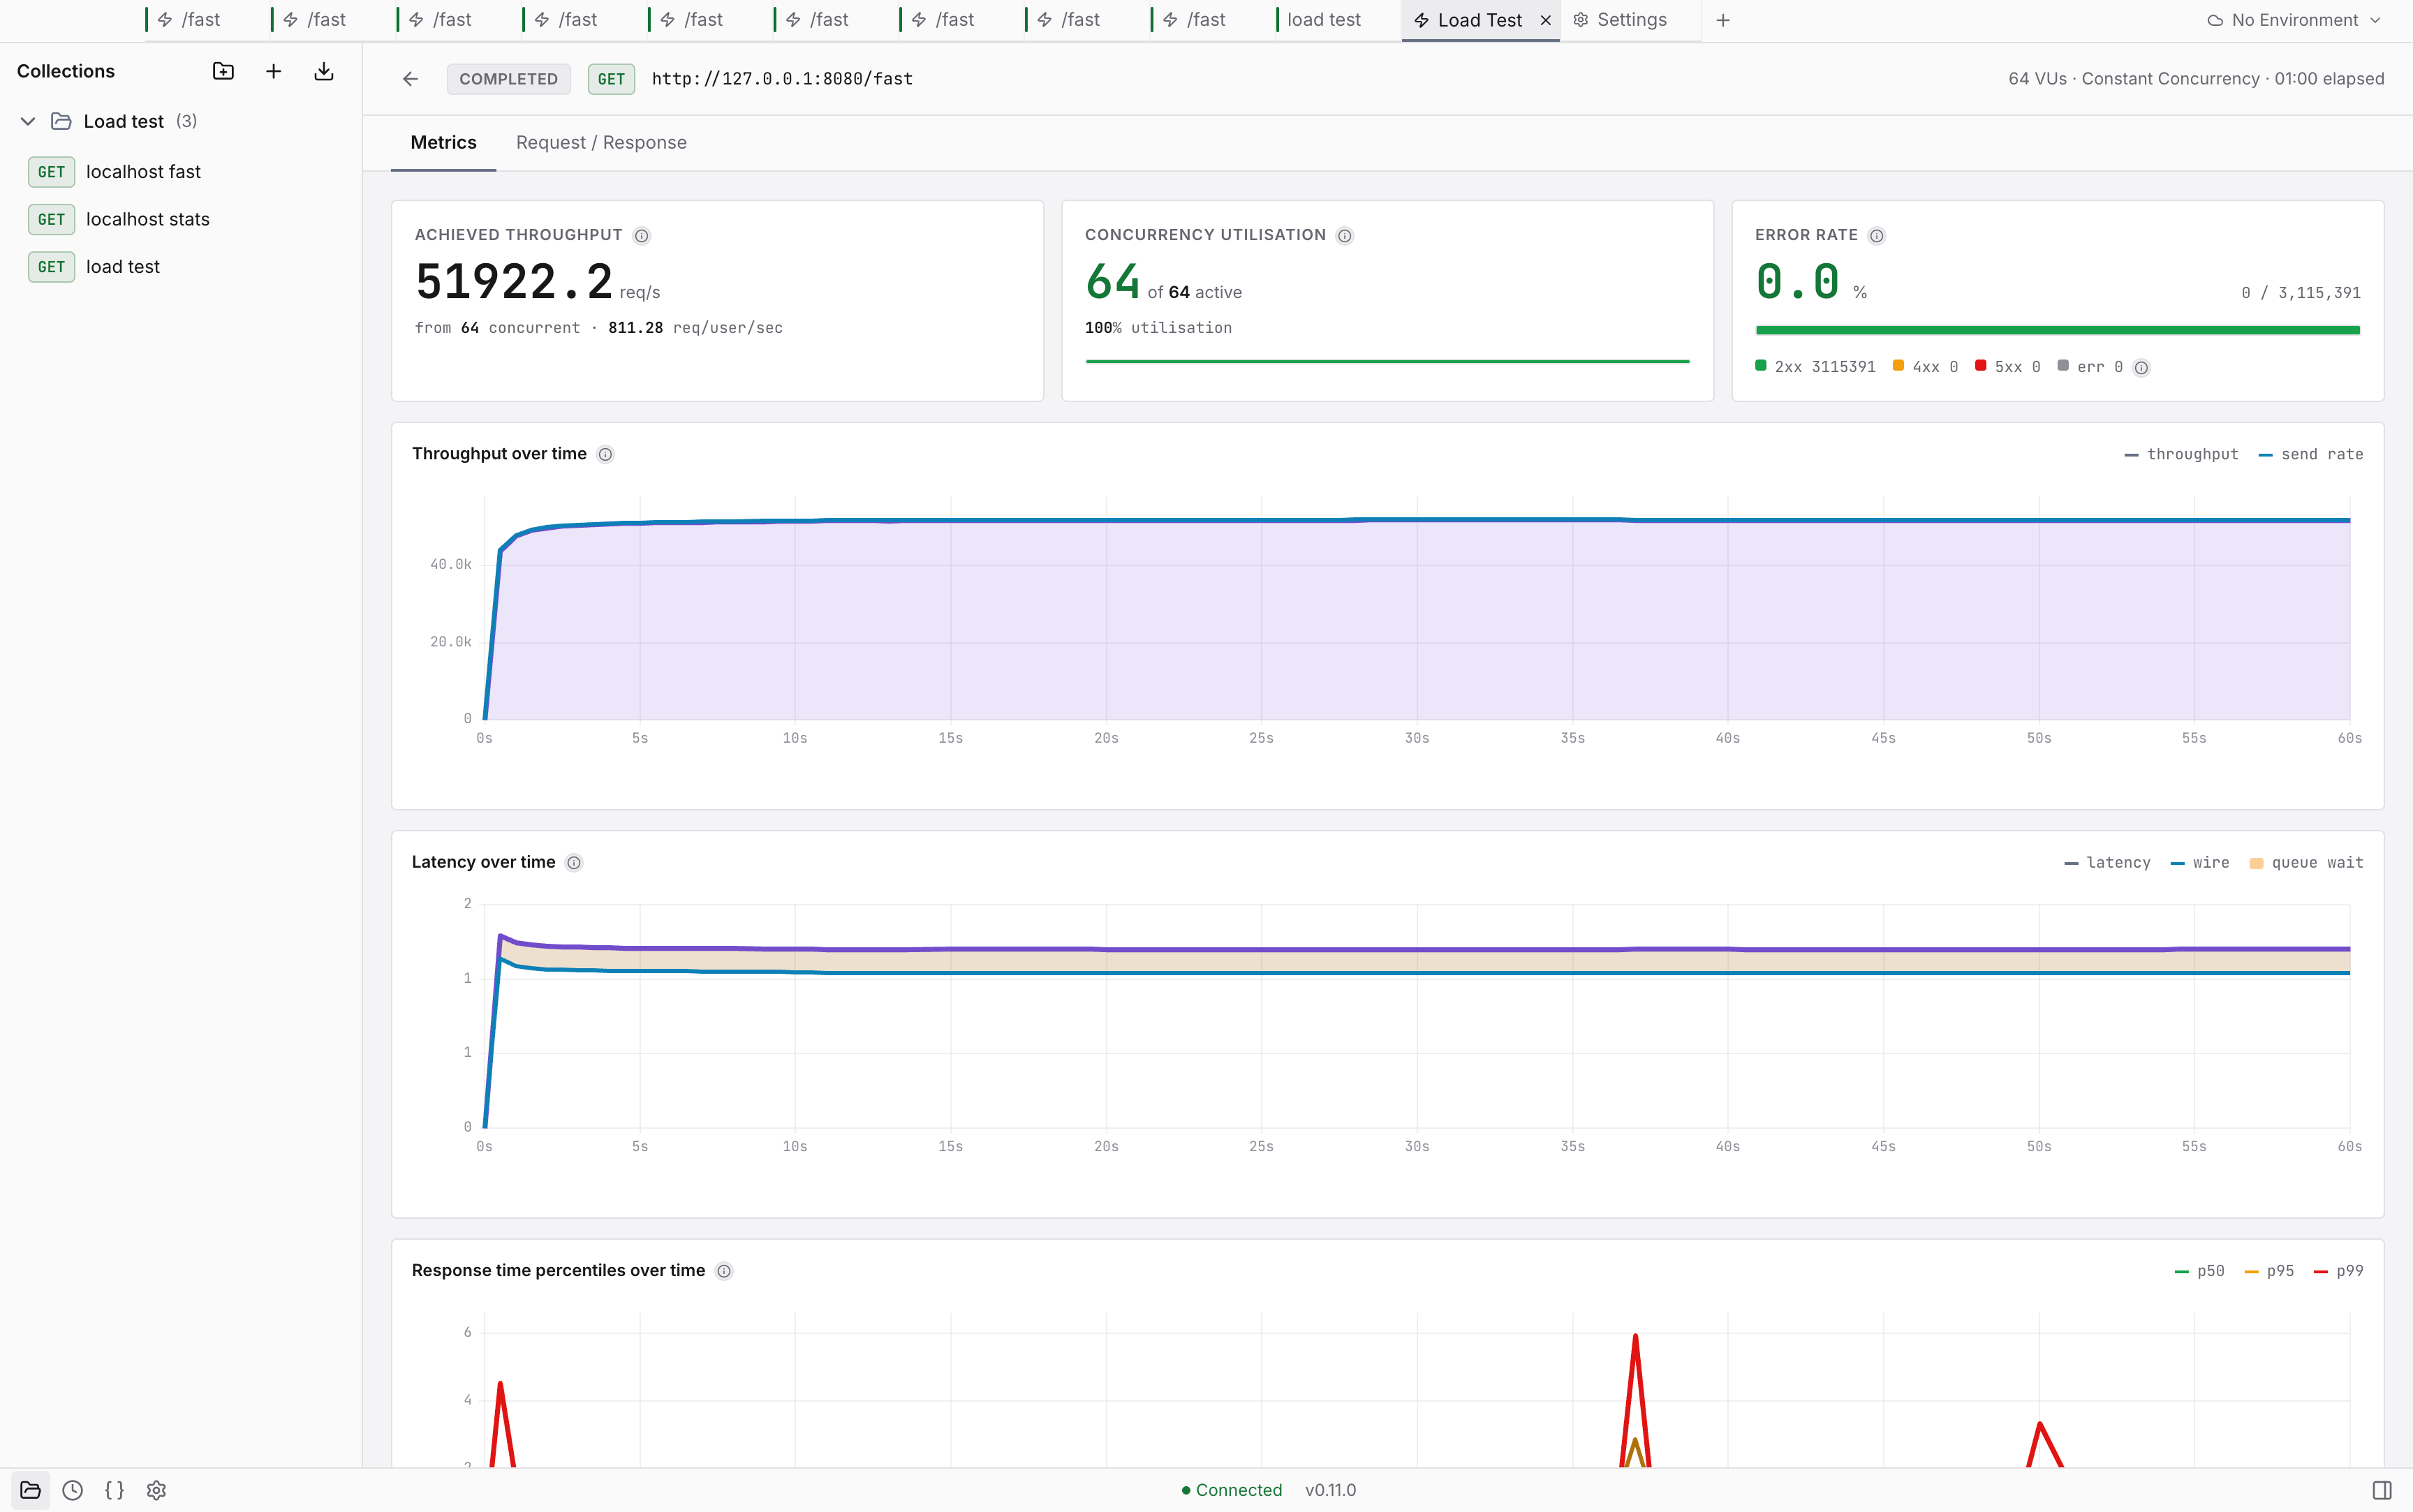
Started from the app's own Load Test panel (not the CLI, not MCP), 60 s, constant concurrency 64, against a saved request:
| Metric | 15 s run | 60 s run |
|---|---|---|
| Throughput | 50,985 req/s | 51,922 req/s |
| Total requests | 764,831 | 3,115,391 |
| Errors / failed / dropped | 0 / 0 / 0 | 0 / 0 / 0 |
| p50 | 1.195 ms | 1.195 ms |
| p95 | 1.399 ms | 1.383 ms |
| p99 | 1.935 ms | 1.516 ms |
| p999 | 6.455 ms | 2.819 ms |
| max | 37.983 ms | 16.319 ms |
| setup overhead | 0.508 s | 0.119 s |
Use 60 s for any headline figure. The tail improves markedly with the longer
window because the fixed cost of opening 64 connections is amortised over 4x the
requests. Those opening connects are also the source of max (38.0 ms at 15 s,
16.3 ms at 60 s), so max on a short run is not a steady-state number. Trace
samples confirm connection reuse is working: the first batch carries a real
dnsMs / connectMs, every sample after it reports 0.
Between c=64 and c=128 the app engine sits inside a 0.8% band (51,439 / 51,849 /
51,743 at c=64 / 96 / 128), and the live-tick rate does not measurably affect
throughput (liveTickIntervalMs 500 vs 1000: 51,518 vs 51,439) - so it can be
left at 500 ms for a smoother chart.
The app's memory at idle and in use (2026-09-07, Windows, packaged 0.26.0)
The engine's footprint is not where the app's memory goes: at idle it holds about 4 MB, and under a 200 RPS run about 47. This section is the rest of the picture, per process, taken on the same i5-8300H laptop as the timer sections above (GTX 1050 Ti with the Intel UHD 630 beside it, a 3840x2160 display at 125%), on the packaged 0.26.0 installed from winget. It is the baseline #1562 was measured against; the branch column is that PR.
Instrument. Private bytes per process from Win32_Process every 5 s, the
Electron process type read off each command line (--type=). Working set is
not used: it moves with shared DLL pages and read 130-210 MB for the GPU
process across runs where private stayed within 5 MB. Chromium's own
allocator breakdown comes from a disabled-by-default-memory-infra trace over
CDP; the renderer's JS heap from Runtime.getHeapUsage (performance.memory
is quantised and rate-limited, and read the same number for a whole session).
Idle is sampled at 45 s after launch: the first update check fires at 60 s
and the main process commits ~30 MB at that moment (libuv's four threadpool
workers, each with an 8 MB stack that Windows commits rather than reserves;
1562 sizes the pool to one), so a sample straddling it reads as noise.
The floor. A copy of the same Electron binary with the asar replaced by a
main.cjs that opens one same-size frameless window on a blank page. Nothing
in this row is Vayu's, and most of it is the graphics driver:
nvwgf2umx.dll alone maps 85 MB into the GPU process, and dxcompiler.dll
another 25.
| private MB at idle | main | renderer | GPU process | network | engine | total |
|---|---|---|---|---|---|---|
| floor: empty window, same binary | 30 | 22 | 142 | 12 | - | 206 |
| 0.26.0, a restored request tab with its body editor | 83-86 | ~100 | ~181 | 12.5 | 4 | 375-385 |
| 0.26.0, Welcome tab only | 79 | 50 | 181 | 12.4 | 4 | 327 |
| #1562's branch, same restored tab | 51-54 | ~100 | ~181 | 12.5 | 4 | ~345 |
| #1562's branch at 150 s, after the update check | 59-62 |
The renderer's ~50 MB between the Welcome row and the restored-tab row is
Monaco plus the request surface; the app shell itself is 28 MB over a blank
page. The GPU process is compositor tiles and swap-chain buffers at that
resolution on top of the driver, and app.disableHardwareAcceleration() is a
loss here (404 vs 373 MB total: SwiftShader keeps the GPU process at ~180 and
software raster adds 14 to the renderer). Minimising the window releases
nothing. The main process was the one place with something structural in it,
which is what #1562 removed: a 14,479-file asar header Electron parses on every
launch and keeps (-25 MB), the MCP SDK evaluated for a server no request had
reached (-5), and the threadpool commit (-24 of commit charge).
In use. The app was driven the way a user drives it - the request opened from the tree, Send clicked, the load test started from the URL bar's Load Test dialog so its own live dashboard opened - with fixtures created and deleted through the MCP tools. The target was a local server answering a 17 KB JSON body after 5 ms.
| private MB, a request | main | renderer | GPU process | engine |
|---|---|---|---|---|
| idle, run tab restored | 84 | 105 | 197 | 4 |
| request tab opened | 85 | 119 | 250 | 4 |
| first Send: response pane and its editor mount | 85 | ~150 | 258 | 4.5 |
| 20 Sends back to back, peak mid-burst | 85 | 199 | 240 | 4.6 |
| 60 s after the burst | 85 | 121 | 243 | 4.7 |
The renderer's JS heap over the same sequence: 20 MB idle, 23 with the tab, 27 after the twenty sends. What a burst leaves behind is 2-6 MB over the open tab.
| private MB, a 200 RPS x 30 s load test (5,999 requests, live dashboard with 5 charts) | main | renderer | GPU process | engine |
|---|---|---|---|---|
| before | 85 | 100 | 227 | 9 |
| running, t+5 / t+15 / t+25 s | 85 | 119 / 106 / 108 | 334 / 300 / 298 | 41 / 43 / 45 |
| done +5 s | 85 | 104 | 321 | 12 |
| done +125 s | 85 | 105 | 320 | 6 |
| both tabs closed, +60 s | 85 | 113 | 310 | 6 |
The engine holds its response reservoir for the run's length and releases it
within 5 s of completion. The renderer is flat while streaming (JS heap 22-23
MB); the five accelerated canvases cost it 28 MB while on screen and nothing
after. The GPU process's Chromium-tracked memory returns to where it started
(gpu/shared_images 39 MB before, 82 during, 46 after), but the process's
private bytes stay 70-100 MB up: the driver pools freed texture memory,
nothing references it, the next charts reuse it, and it shrinks under memory
pressure (a critical-pressure signal took 26 MB off it in a separate
measurement). That is the one number in these tables that does not come back
on its own, and it is not the app's to give back.
Leak check. After the run, with both tabs closed and a forced GC: a heap
snapshot holds 0 detached DOM nodes and 0 live uPlot instances, and the
window / document listener counts are identical to before the run (the
five dppxchange listeners the charts add are gone). UPlotChart.tsx tears
down its plot and its ResizeObserver on unmount, and the numbers agree.
Verdict: nothing leaks; every cost is bounded and returns when its phase
ends, except the driver's texture pool. The idle number is the floor plus
Monaco plus tiles at 4K, and the main-process share is the part #1562 takes.
For the next measurement: sample at 45 s or after 150 s, never across the 60 s
check; create fixtures over MCP and delete them with confirmed: true
(destructive tools answer a preview first) - list_runs returns { data }
and carries no URL, so name probe runs by their request.
A paced scenario run no longer pins a core (2026-09-08, engine 0.26.x)
timer.pacing deferred a virtual user by stamping a future ready_at_ms, but
a deferred user is not in flight - so the producer's own in_flight() <
target wait predicate stayed true for as long as any user was paced, and
refill_cv.wait_for returned at once regardless of the duration it was given
(issue #1596). A run's own request rate made no difference: this was the
producer thread spinning its wait away, not real work.
One virtual user, timer.pacing at 500ms, run for 2s in-process against the
test mock server (ElementsTimersLoadTest.APacedRunDoesNotBusySpinTheProducer,
whole-process getrusage/GetProcessTimes sampled before and after):
| producer CPU over 2s | % of one core | |
|---|---|---|
| Before | ~2,059 ms | ~100% |
| After | ~65 ms | ~3% |
Pacing precision is unaffected - the bounded wait is exactly the remaining deferral, so a 10ms cadence still holds to about 1%, which is why nothing noticed this for as long as it went undiagnosed.
Worker affinity, thread priority and precise sleep off Windows (2026-09-15)
Two related additions to load generation, both best-effort and both landing without a measured number of their own:
CPU affinity and a modest scheduling-priority bump for load-generation
threads. An event-loop worker calls platform::pin_current_thread and
platform::raise_current_thread_priority once, at the top of its own thread -
but only when core::worker_cpu_index says there is a core to spare; without
one, neither call happens. Priority rides the same gate as pinning
deliberately: raising every worker's scheduling priority with no dedicated
core to run on just means they all compete more aggressively for the same
cores as everything else sharing the machine, which risks starving those
instead of pacing more accurately. The run's pacing thread (run_manager.cpp's
execute_load_test, the thread that runs wait_for_next_tick) is the one
exception: it raises its own priority unconditionally, since it is always a
single thread and never pinned. worker_cpu_index itself only activates
pinning when an operator has capped workers below the detected core count,
reserving CPU 0 for the OS, the UI and the pacing thread rather than pinning
1:1 across every core - see its doc comment
(include/vayu/core/worker_count.hpp) for why 1:1 would make a run measure
the laptop instead of the target. Neither call reaches for
a realtime scheduling class (SCHED_FIFO/SCHED_RR on Linux,
THREAD_TIME_CONSTRAINT_POLICY on macOS): the engine shares the machine with
the app it is a sidecar for and with the target under test, and a realtime
thread that misbehaves can starve both. Both calls are refused outright in a
container or sandbox that denies the underlying syscall - sched_setaffinity,
thread_policy_set, setpriority, SetThreadAffinityMask - and the engine
logs once per process and keeps running unpinned at the default priority
rather than failing a run over it.
Precise sleep for the tick-pacing loop, off Windows too. Issue #1370 gave
wait_for_next_tick a sleep-then-spin shape on Windows, because
sleep_for's overshoot there is large enough to pay back as a double dispatch
on the next tick (measured in the section above). That shape is now
unconditional: Linux sleeps the coarse leg with
clock_nanosleep(CLOCK_MONOTONIC, TIMER_ABSTIME, ...) and macOS with
mach_wait_until, both absolute waits rather than sleep_for's relative one,
and both still spin the last pacing::spin_tail_us (remaining) of every tick
exactly as the Windows leg always has.
The tail is a per-platform function of the remaining tick, not one flat
number. Windows and Linux keep the flat shape (spin_tail_us always
returns the platform's constant, regardless of the remainder); macOS does
not, because its overshoot itself is not flat. Real measurement on an Apple
M3 Pro (macOS 26.7, 400 samples/row, mach_wait_until
actual - requested overshoot, engine+Electron running concurrently - see
issue #1667's comment
for the full table) found the overshoot scaling with the requested sleep
duration up to ~5-10ms, then plateauing around ~1020-1060us - consistent with
XNU's timer-coalescing leeway (slop proportional to the timer length, capped)
rather than Windows' fixed wakeup cost. A single fixed tail cannot cover
both ends of that: sized for the low-RPS/long-tick case (~1100us) it would
busy-spin an entire core at high RPS (1500 RPS = 667us ticks, wholly consumed
by the spin); sized for high RPS it misses the deadline at low RPS (the old
300us placeholder already overshot by ~2x at 200 RPS before any spin
happened). So macOS's spin_tail_us is
min (remaining / 9 + 60, 1100) (constants::pacing::MACOS_DIVISOR /
MACOS_BASE_US / MACOS_CAP_US), reproducing that shape: near-zero at very
short remainders, tracking the measured line through the mid-range, and flat
at the plateau. Linux's tail is still a placeholder, not a measurement:
pacing::spin_tail_us there stays flat at 150us, sourced from the kernel's
documented ~50 us default timer slack plus scheduler-wakeup margin, with no
actual - requested table behind it. Issue #1667
still tracks that Linux measurement.
Prior results (2026-07, CLI, unreconciled)
These numbers were measured earlier via scripts/test/bench-compare.sh on a
quieter machine. The ceiling agrees with the session above; the shape of the
curve does not, and the discrepancy is not yet explained.
Throughput vs concurrency (single run each, /fast, workers=8)
| concurrency | wrk (req/s) | vegeta (req/s) | vayu (req/s) | vayu / wrk |
|---|---|---|---|---|
| 64 | 56,649 | 44,065 | 37,148 | 66% |
| 128 | 57,765 | 55,783 | 51,385 | 89% |
| 256 | 56,124 | 52,837 | 53,967 | 96% |
Clean repeated runs @ c=128 (cooled, 12 s each)
| rep | wrk (req/s) | vegeta (req/s) | vayu (req/s) |
|---|---|---|---|
| 1 | 56,884 | 49,258 | 50,772 |
| 2 | 56,978 | 55,960 | 53,868 |
| 3 | 56,543 | 56,215 | 53,835 |
| avg | 56,802 | 53,811 | 52,825 |
The open discrepancy. This table has Vayu at 66% of wrk at c=64, rising to
its best at c=256. The 2026-07-29 session measured the opposite curve: best at
c=64 (56,880, above wrk), declining past c=192. A 37,148 vs 56,880 gap at the
same concurrency is far too large to be run-to-run noise, so one of the two
measurements is not measuring what it claims. Re-running
scripts/test/bench-compare.sh on a quiet machine is the way to settle it - do
that before quoting either curve shape. The public comparison page quotes the
2026-07-29 figure and carries this caveat beside it, so the two pages agree
rather than contradict:
Vayu vs k6.
Reading the results
- Convergence at the ceiling. Pushing past the optimum makes every client slower, and at 52k the machine is ~79% idle - the classic sign that the bottleneck is the shared target/CPU rather than any client. Vayu was never the bottleneck in any measurement on this page, which also means ~57k is not Vayu's ceiling; finding that needs a faster target (nginx serving a static byte, or a target on another machine over a fast link).
- The claim to make. Vayu is on par with
wrkandvegetaon this target. Measured the same way, on the same machine, in the same session, it edged pastwrk- but by less than the spread between machines, so "matches" is the defensible word, not "beats". - Tune concurrency before anything else. c=400 costs 17% of throughput and 38x the p99 versus c=64. No engine knob on this page moves the number that far.
The app-engine gap
The app's engine (51.4k-52.0k) runs about 9% slower than a standalone engine (56.2k-56.9k) on identical settings. The effect is real and reproducible; the cause is not isolated. Three candidates are ruled out by measurement:
- Not verbose logging - verbose on was marginally faster.
- Not the live-metrics tick rate - 500 vs 1000 ms made no difference.
- Not the DB pragmas - the standalone instance ran a fresh DB on default pragmas and was still 9% faster.
What remains untested: Electron's own CPU use, and the app engine's much larger DB (200-run retention plus a prune pass after every run) versus a fresh scratch DB. Note this is the same direction as, but far smaller than, the 30-40% UI contention figure this page previously carried - that larger figure was not reproduced and should not be quoted.
Config semantics: live, restart-gated, and retired
Every entry below was verified by locating the read site in the engine source.
| Key | Read site | When it applies |
|---|---|---|
workers |
core/run_manager.cpp |
Per run. No restart - and the entry says so since #873, which dropped the requiresRestart: true it had carried |
eventLoopMaxPerHost |
core/run_manager.cpp |
Per run |
eventLoopMaxConcurrent |
core/run_manager.cpp |
Per run, but overridden by the run's own concurrency |
dnsCacheTimeout |
core/run_manager.cpp |
Per run |
scriptEnableConsole |
core/run_manager.cpp |
Per run |
liveTickIntervalMs |
core/run_manager.cpp |
Per run |
maxResponseBodyBytes |
core/run_manager.cpp |
Per run |
oauth2RefreshLeadMs, oauth2RefreshMinIntervalMs, oauth2RefreshRetryMs, oauth2RefreshRetryMaxMs, oauth2RefreshPollIntervalMs |
core/auth_refresh.cpp (read at core/run_manager.cpp) |
Per run. Mid-run OAuth 2.0 renewal: lead time, floor between renewals, the retry backoff's first wait and ceiling, and how often the watchdog wakes to notice the run ended |
inboxMaxBodyBytes, inboxMaxCaptures, inboxLivePollIntervalMs |
http/routes/inbox.cpp (read_inbox_limits) |
Per inbox. Resolved when POST /inbox/start runs; a running inbox keeps what it was started with |
dbSynchronous, dbBusyTimeout, dbCacheSize |
db/database.cpp |
DB open. Restart required. dbCacheSize is per-connection state, so it is re-applied to every connection from the value read at startup |
logLevel, maxLogFileBytes |
daemon.cpp (applied to utils/logger.cpp) |
Daemon start, just after the database opens. Restart required. The lines written before that point are the ones the file sink's default level allows |
The dead entries this table used to list - maxConnections and statsInterval,
plus tcpKeepAliveIdle / tcpKeepAliveInterval, maxJsonFieldSize, the three
sse* keys, and the three database PRAGMAs with no tuning story
(dbTempStore, dbMmapSize, dbWalAutocheckpoint) - were retired in
#519. They no longer seed, and an
upgraded database sheds the rows. The behaviour they claimed to control is
unchanged: each one's constant is still what the engine applies.
loop_config.max_concurrent is set from the run's concurrency, which is why
eventLoopMaxConcurrent acts only as a default for runs that do not specify one.
GET /health's workers field is std::thread::hardware_concurrency(), not
the configured worker count - it reported 12 while the engine was configured
for and running 8. There is currently no way to read the effective worker count
over the API. The workers A/B above was therefore validated by counting the
engine's OS threads - ps -M <pid> | tail -n +2 | wc -l, which read 15 idle, 25
at workers=8 and 29 at workers=12, a delta of exactly 4 matching the config
delta.
Tracked in #197.
Engine tuning notes
Knobs that move RPS (set via POST /config; all of the engine-config ones below
are read per run, so none needs a restart - and none is flagged
requiresRestart either, since #873):
- run
concurrency- the dominant lever, and it is a property of the run, not the engine config. 64 on this target. Note the MCP safety cap (maxConcurrency, default 400) is a ceiling, not a suggestion: driving at 400 produces a worse headline number than 64. workers- libcurl-multi event-loop threads. 8 is the sweet spot on this 6P+6E machine, chosen for tail latency; 12 (= core count) ties on throughput but roughly doubles p99. Worker threads are created per run, so the effective value is observable as a thread-count delta (15 idle → 25 atworkers=8→ 29 atworkers=12).maxInFlight(per-run, open-loop) - the dispatch hard cap. The defaultmax(targetRps × 10, 1000)is effectively unbounded at high target RPS and causes congestion collapse (in-flight balloons to tens of thousands, multi-second queue latency, throughput halves). Bound it to ~256-500 for clean, low-latency saturation. Closed-loop constant-concurrency avoids the issue entirely. Bounding it does not hide the demand: requests that come due while the cap is reached are counted as dropped, so a run that could not keep up says so instead of running past itsdurationto catch up.eventLoopMaxPerHost- not binding at c=64; 200 → 500 changed nothing. Note it is applied per worker, so the effective per-host budget isworkers × maxPerHost.dnsCacheTimeout- set it high (3600) for a fixed target; the hostname never needs re-resolution. Worth little on a warm run, since DNS cost per request amortises to ~0.005 ms over 60 s.eventLoopMaxConcurrent- inert for any run that sets its ownconcurrency, which is every run the app starts.
How constant_rps paces. Open-loop, and time-bound rather than quota-bound:
each tick accrues targetRps × elapsed and dispatches the whole requests owed,
carrying the fraction to the next tick. Rate fidelity therefore does not depend
on the tick length (1ms above 1000 RPS, the request interval below it) - timer
jitter is corrected on the following tick, and a rate like 1500 RPS is delivered
as asked rather than floored to the nearest 1000. Comparing against wrk/vegeta
at a fixed rate, sent + dropped should equal targetRps × duration.
How a tick waits. Rate fidelity is not arrival regularity, and the two
have different mechanisms. Since #1370
(Windows) and #1667 (Linux,
macOS) every tick ends on a busy-spin and only the stretch before it is
slept, on all three platforms: platform::sleep_until_precise(next_tick -
pacing::spin_tail_us (remaining)), then spin to the tick.
sleep_until_precise is clock_nanosleep(CLOCK_MONOTONIC, TIMER_ABSTIME,
...) on Linux, mach_wait_until on macOS, and sleep_for's ordinary
relative form on Windows (where the precision problem is the run's 1 ms
timer request plus this same spin tail, not the sleep primitive itself). A
remainder no longer than the tail is spun whole, which is what every tick
from ~500 RPS up already was on Windows - tick_us is 1000us there, and the
Windows tail is a flat 2000us - so nothing above that point moved when #1370
landed.
The tail's shape is platform-specific, not just its size, because each
platform's sleep call overshoots by a different amount and, on macOS, in a
different way: Windows' and Linux's spin_tail_us are flat constants
(2000us, measured; 150us, a placeholder pending real hardware), but macOS's
is min (remaining / 9 + 60, 1100) - proportional to the remaining tick up
to the ~1100us plateau XNU's timer-coalescing leeway produces, real-measured
on an Apple M3 Pro (see the 2026-09-15 section above). Below the spin
threshold the tick used to sleep its whole remainder and land late by the
sleep's overshoot, which the next tick paid back as a double dispatch. The
overshoot now lands inside the tail instead of inside the arrival gap, and
the spin is bounded by the tail rather than by the tick, so its cost does not
grow as the target rate falls.
Recommended settings
For load testing this class of target on this machine:
| Setting | Value | Why |
|---|---|---|
run concurrency |
64 | The dominant lever - peak throughput with a tight tail |
run duration |
60s | Higher average and a much cleaner tail than 15 s |
workers |
8 | Throughput tie with 12, tail latency roughly 2x better |
eventLoopMaxPerHost |
500 | Not binding at c=64; removes any doubt |
dnsCacheTimeout |
3600 | Target hostname never needs re-resolution |
scriptEnableConsole |
false | Matters only when scripts run |
dbSynchronous |
0 (Off) | Already optimal by default |
| measurement method | standalone engine | Worth ~9% versus running through the app |
Per-platform measurement in CI
The numbers above are throughput on one machine. What the engine costs while
it runs - resident memory, threads and CPU at idle, under load, and in the
minute after a run finishes - is measured per platform by
.github/workflows/perf-measure.yml,
weekly and on demand, on the same Windows, macOS and Linux runners the test
matrix uses. It is the source for those figures, and the standing harness the
app-performance program (#1143) re-runs to compare before and after.
It builds the engine on the -prod preset, so its CPU figures carry no
debug-build caveat, spawns it with the same --verbose 1 the app's sidecar
uses, then samples through a 60 s idle phase, one 8-VU 30 s
constant_concurrency run against the same scripts/test/mock-server.go used
here, and 60 s of post-run retention. Each run writes a JSON artifact per OS and
a table to the run summary. It measures rather than gates: there are no
thresholds, and nothing in it fails a build on a number. The sampling itself
lives in scripts/perf/measure_engine.py and runs the same way locally:
go build -o mock-server scripts/test/mock-server.go
python scripts/perf/measure_engine.py \
    --engine engine/build-release/vayu-engine \
    --mock ./mock-server --out perf-engine.json
Reproduce it
# 1. Start the mock server (separate terminal)
go run scripts/test/mock-server.go            # listens on :8080

# 2. Start the engine daemon
engine/build/vayu-engine --port 9876 --data-dir engine/data

# 3. Run the comparison (requires wrk + vegeta on PATH)
bash scripts/test/bench-compare.sh            # prints the markdown table

# tunables via env: URL=... DUR=12 CONCS="64 128 256" WORKERS=8